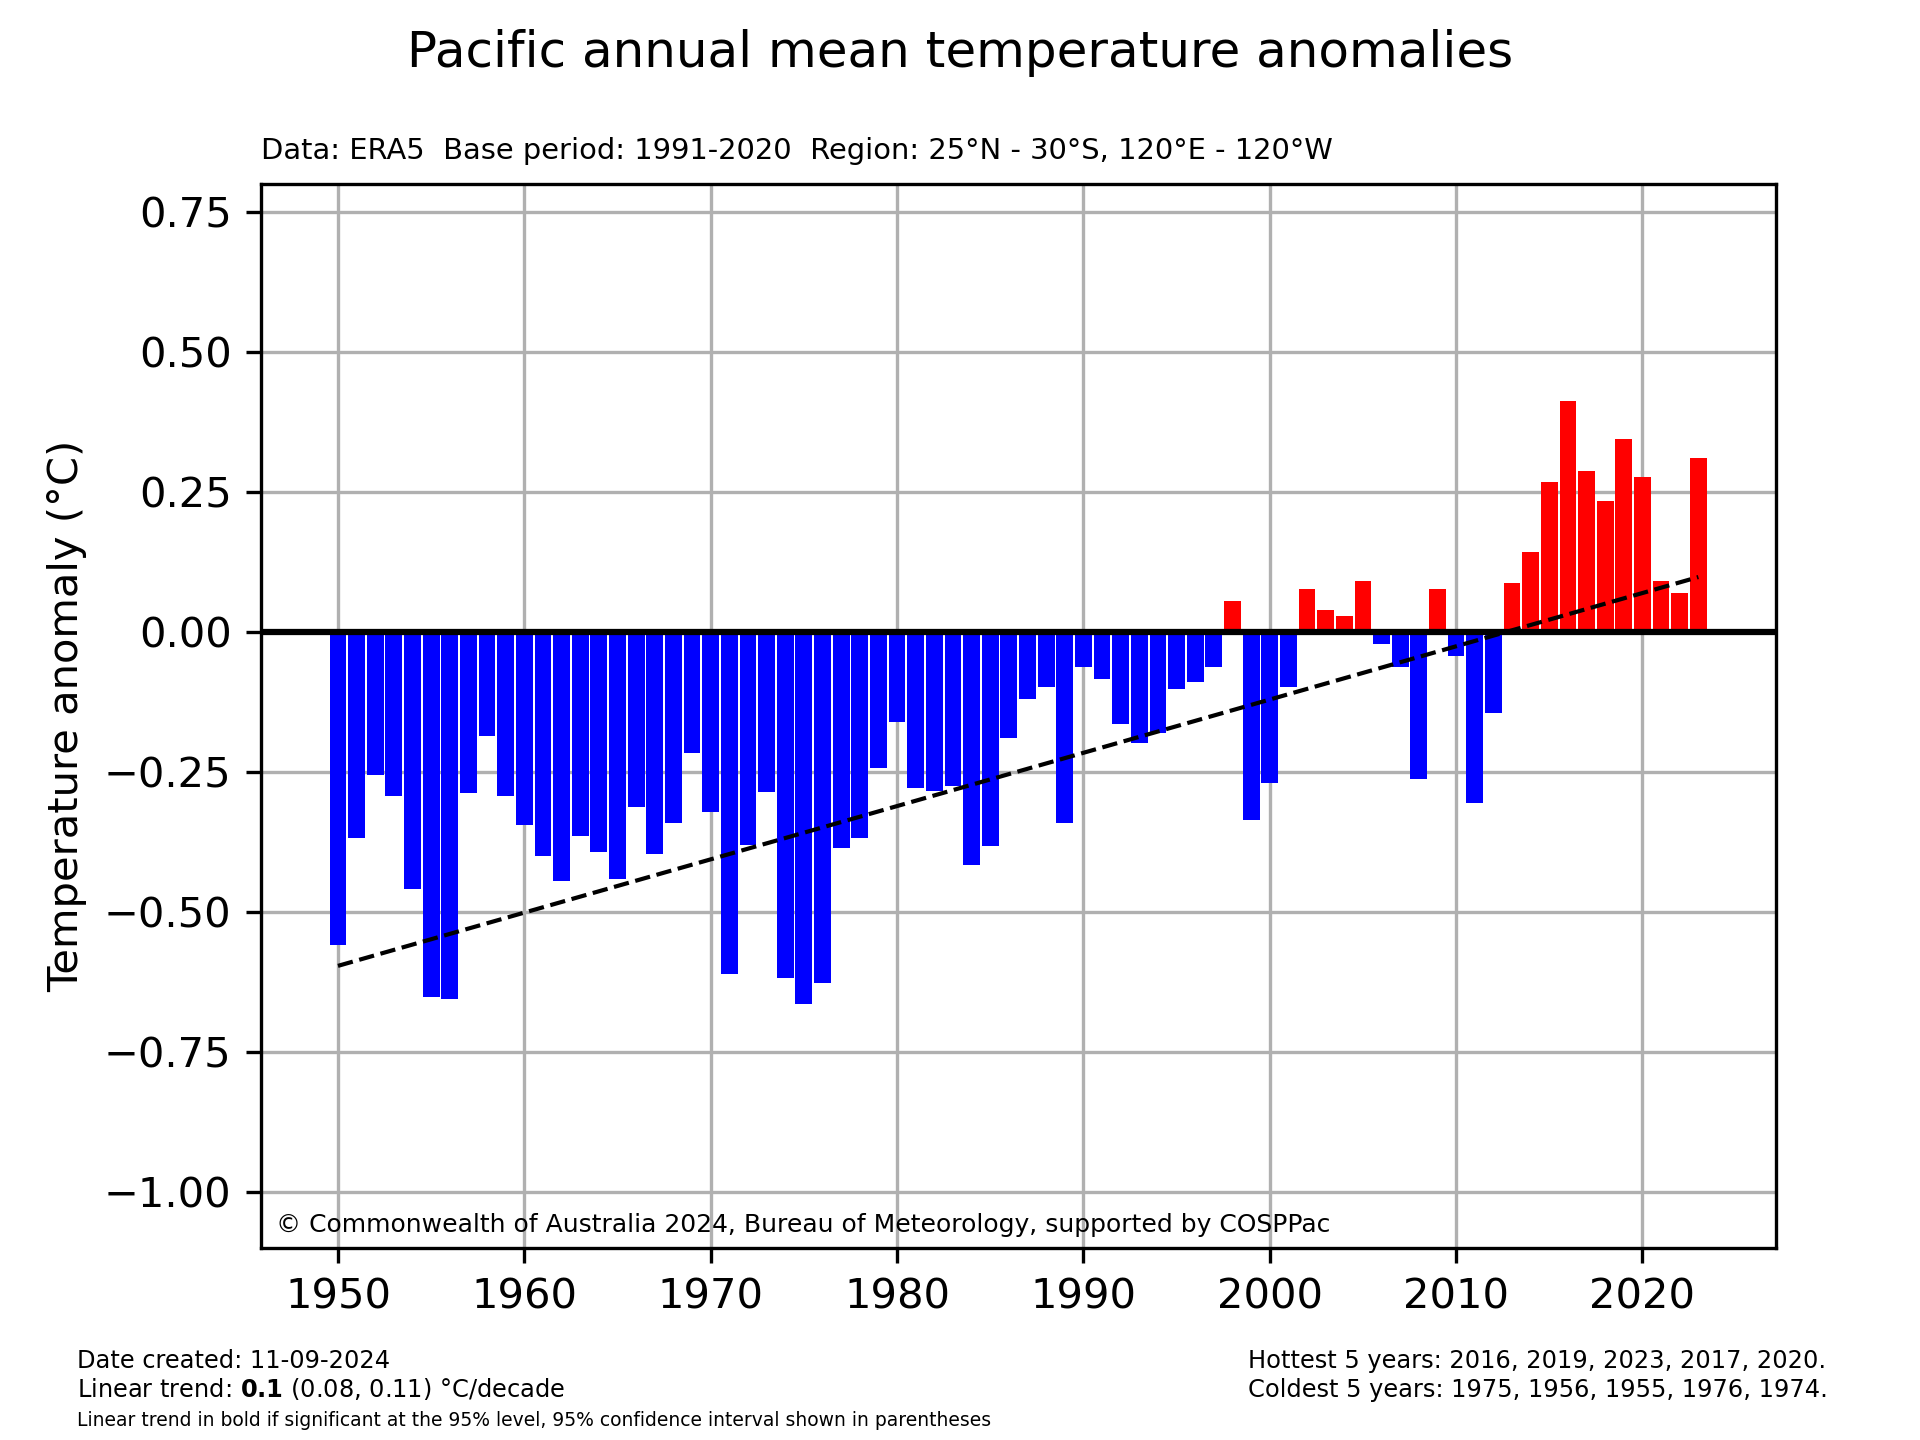
The plots at the above link show time series of temperature anomalies over the Pacific region (25ºN – 30ºS, 120ºE – 120ºW) using data from the ERA5 reanalysis (Hersbach et al., 2020). Plots are available for each month and annually, and for minimum, maximum and mean temperature. An example is shown below. The same plot but for a country’s EEZ is also available upon request.
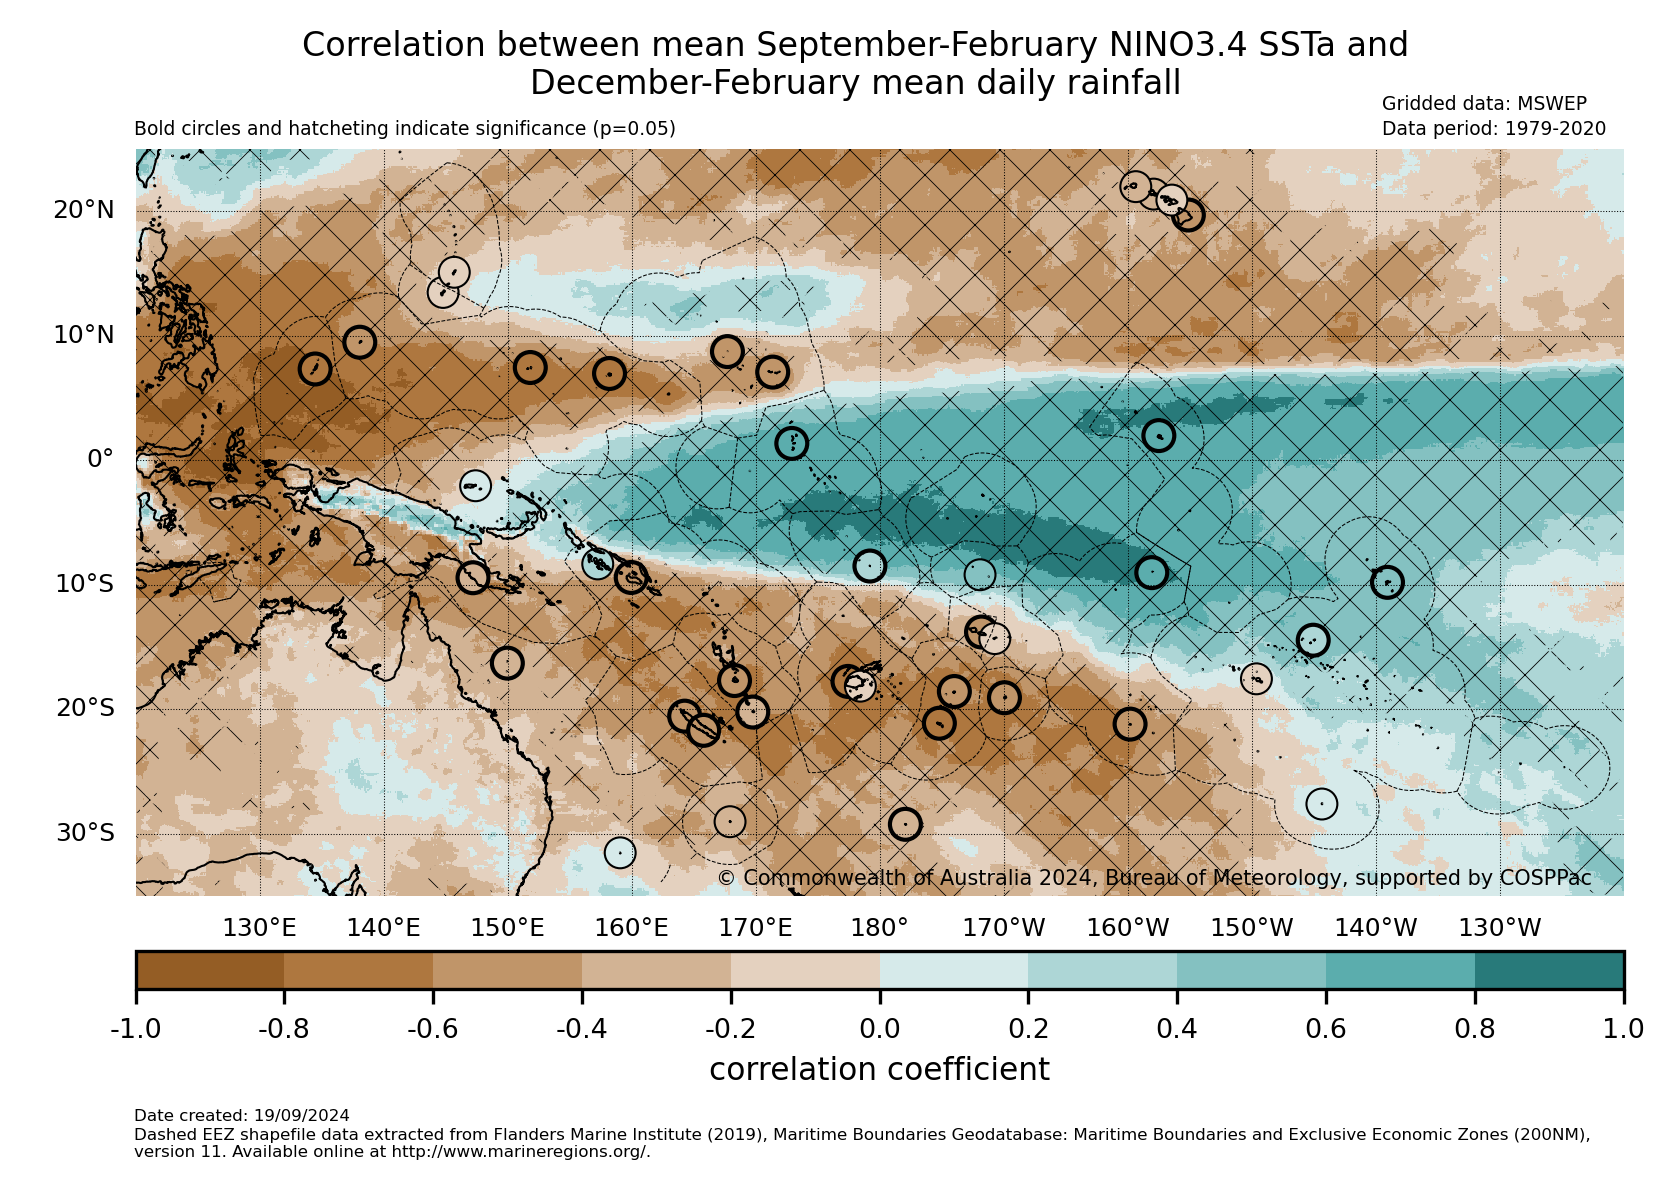
The plots at the above link show the correlation between the the NINO3.4 index of the El Niño–Southern Oscillation (ENSO) and mean rainfall. Long high quality stations across the Pacific (data from the Pacific Climate Change Data Portal) and the gridded product MSWEP (Beck et al., 2019) are used for rainfall. An example is shown below. The data used stops at 2020, and will soon be extended.
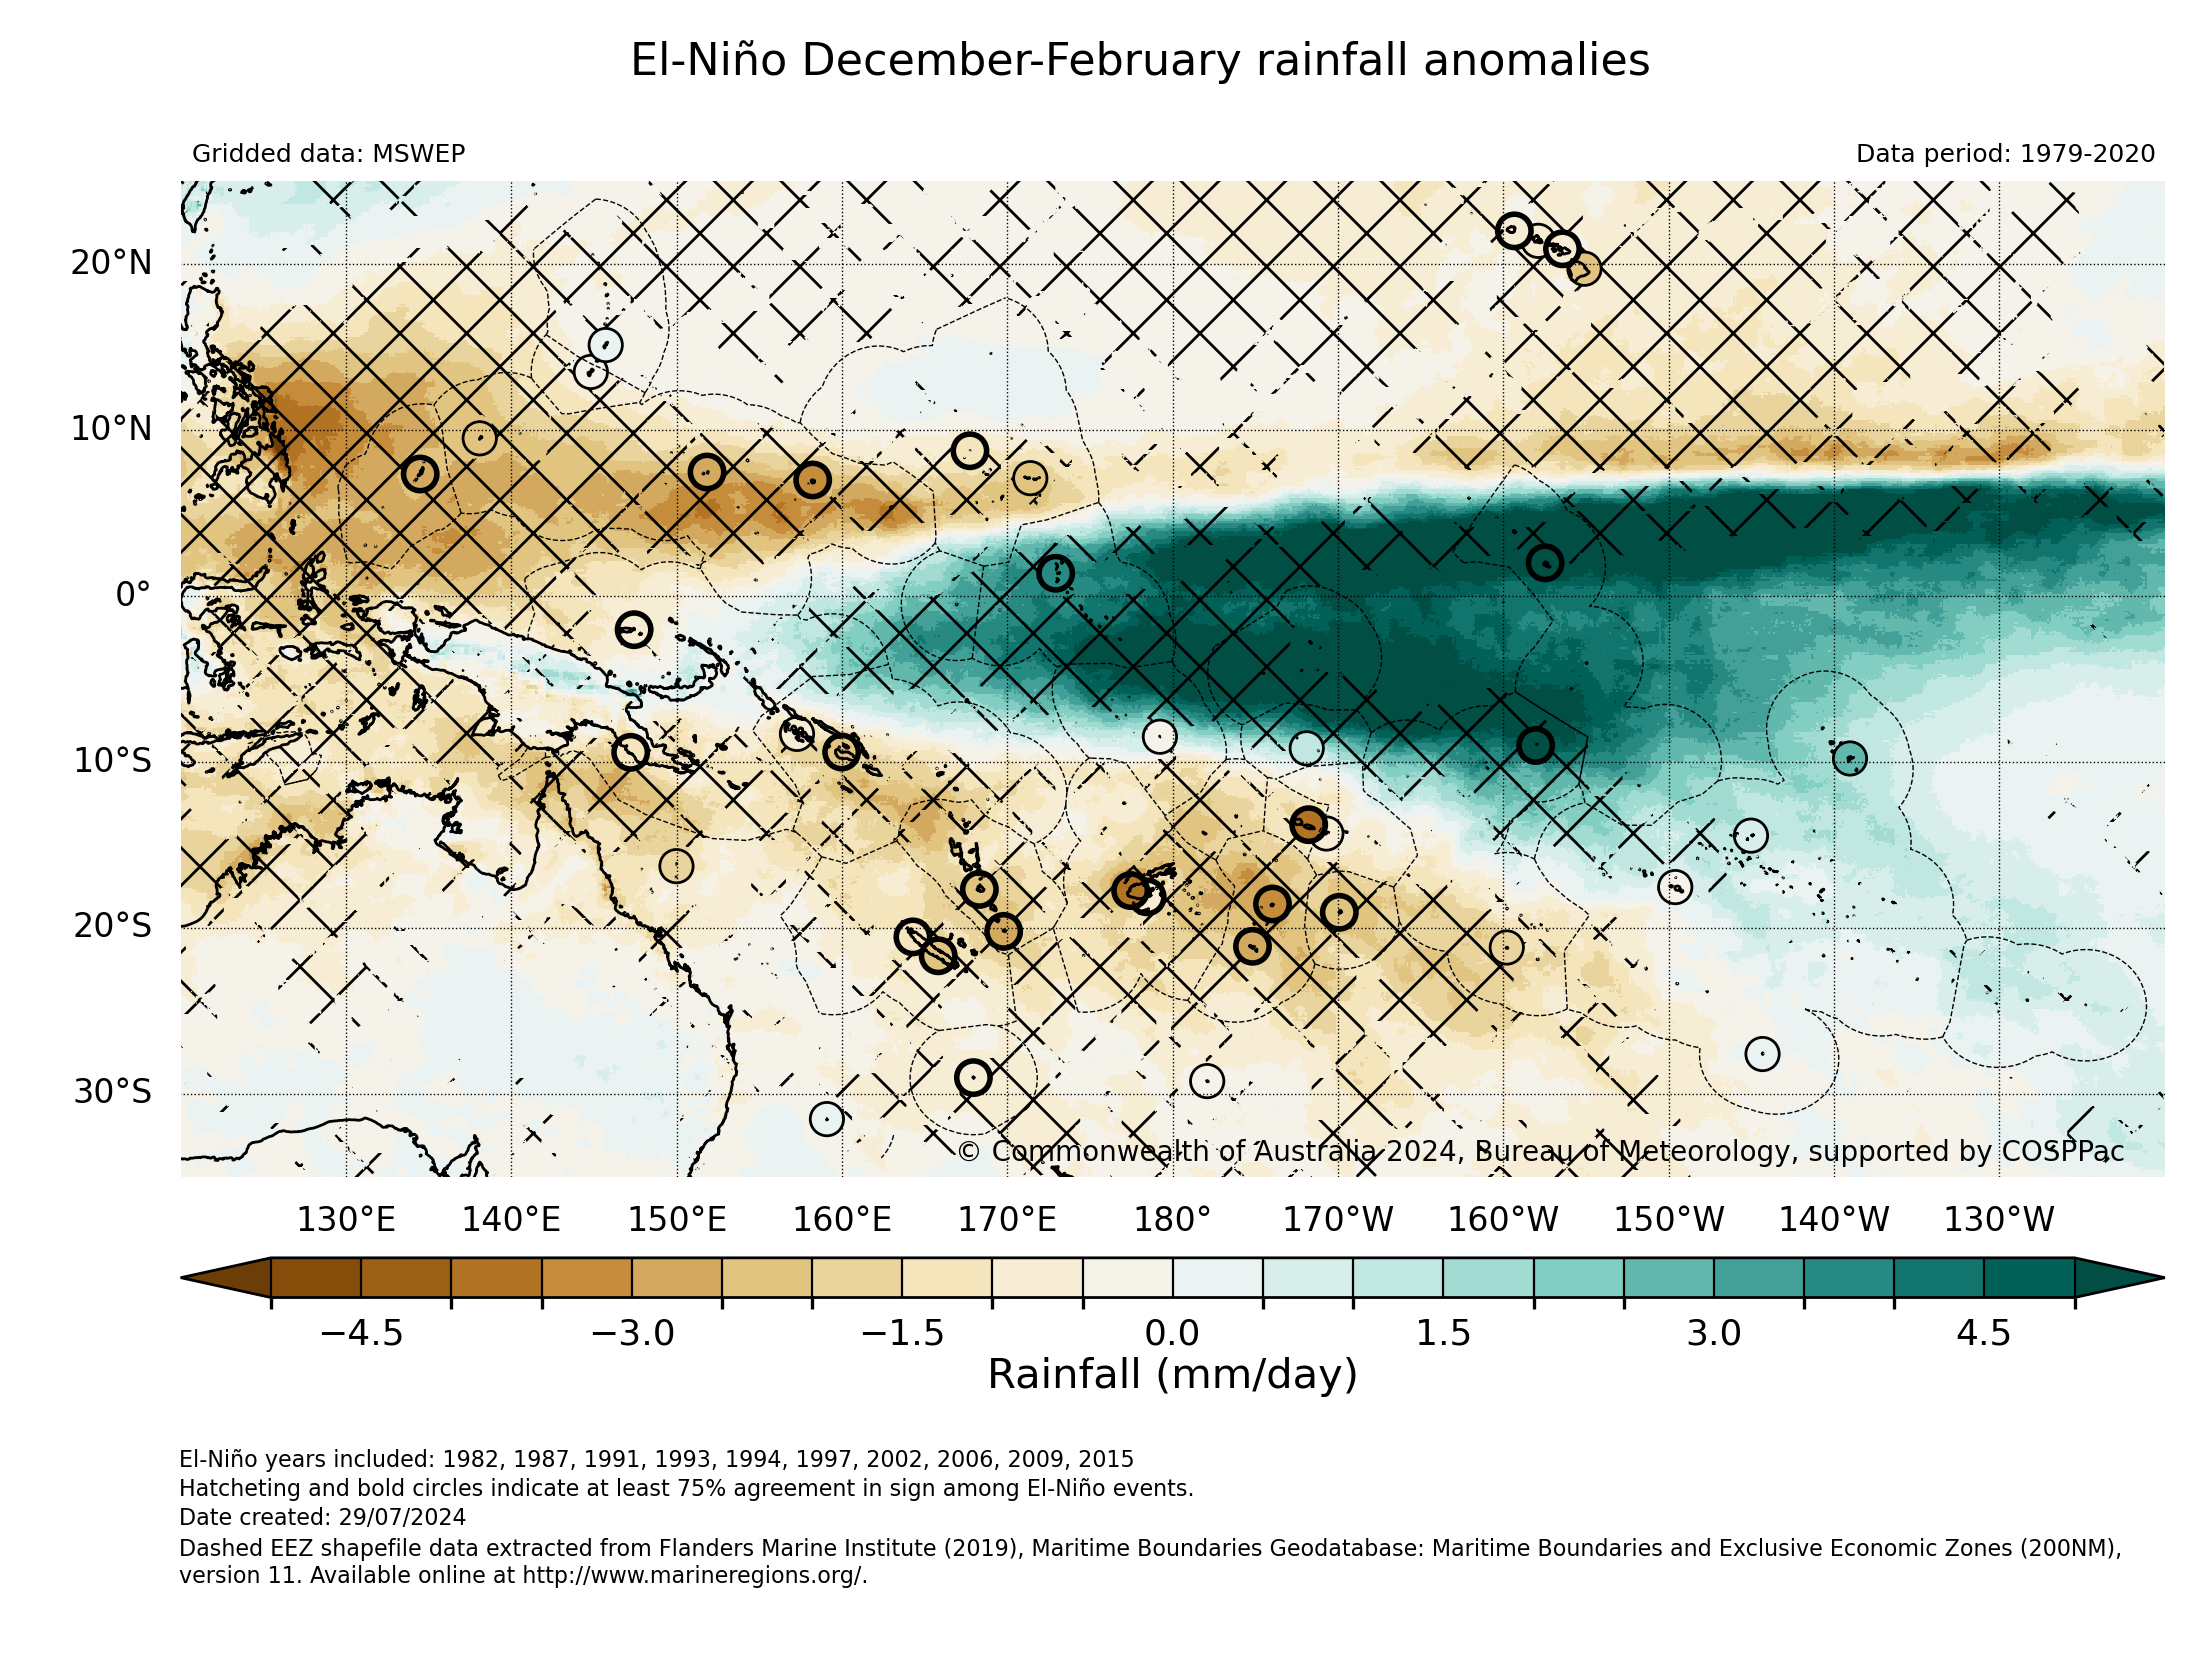
ENSO composite temperature and rainfall maps
The plots at the above link show composite maps of mean temperature and rainfall during El Niño and La Niña years. Gridded rainfall is taken from MSWEP (Beck et al., 2019), gridded temperature is from the ERA5 reanalysis (Hersbach et al., 2020) and station data are from long high quality sites across the Pacific (from the Pacific Climate Change Data Portal). The same maps presented as deciles can be found here. The data used stops at 2020, and will soon be extended.